fft에 대한 기초적인 개념 참고:
https://underflow101.tistory.com/26
[DSP] 푸리에 변환, DFT와 FFT (Fast Fourier Transform) - 1
서 론 FFT란 무엇인가? 프로그래밍을 하다보면, 특히 영상처리, 인공지능(머신러닝/딥러닝), 디지털 신호처리(DSP), 임베디드 시스템, 등을 하다보면 FFT라는 말이 자주 나온다. 그리고 공대생이라
underflow101.tistory.com
단적으로 설명하면 fft는
소리(아날로그 신호)를 다양한 음역대(다양한 주파수)에서 출력이 어떠한지로 변환해 주는 것과 같다. 아래 그림처럼 말이다.

이번에 해볼 예제는
하나의 예제 신호를 fft를 통해 어떤 주파수에서 가장 높은 값을 가지는지 알려주는 예제이다.
아래와 같이 manage libraries를 누른다.
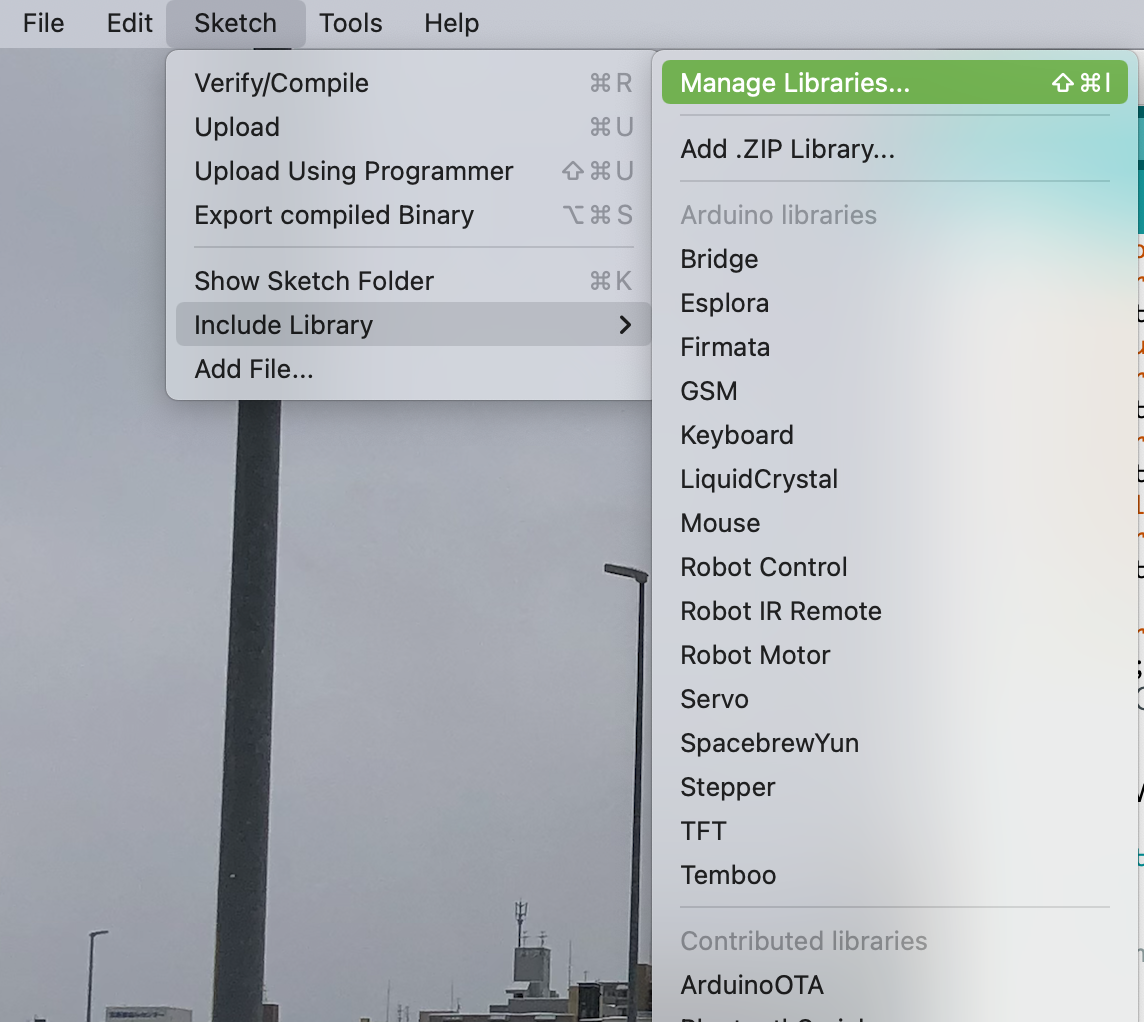
fft를 입력하여 arduinoFFT 라고 적힌 라이브러리를 다운로드한다.
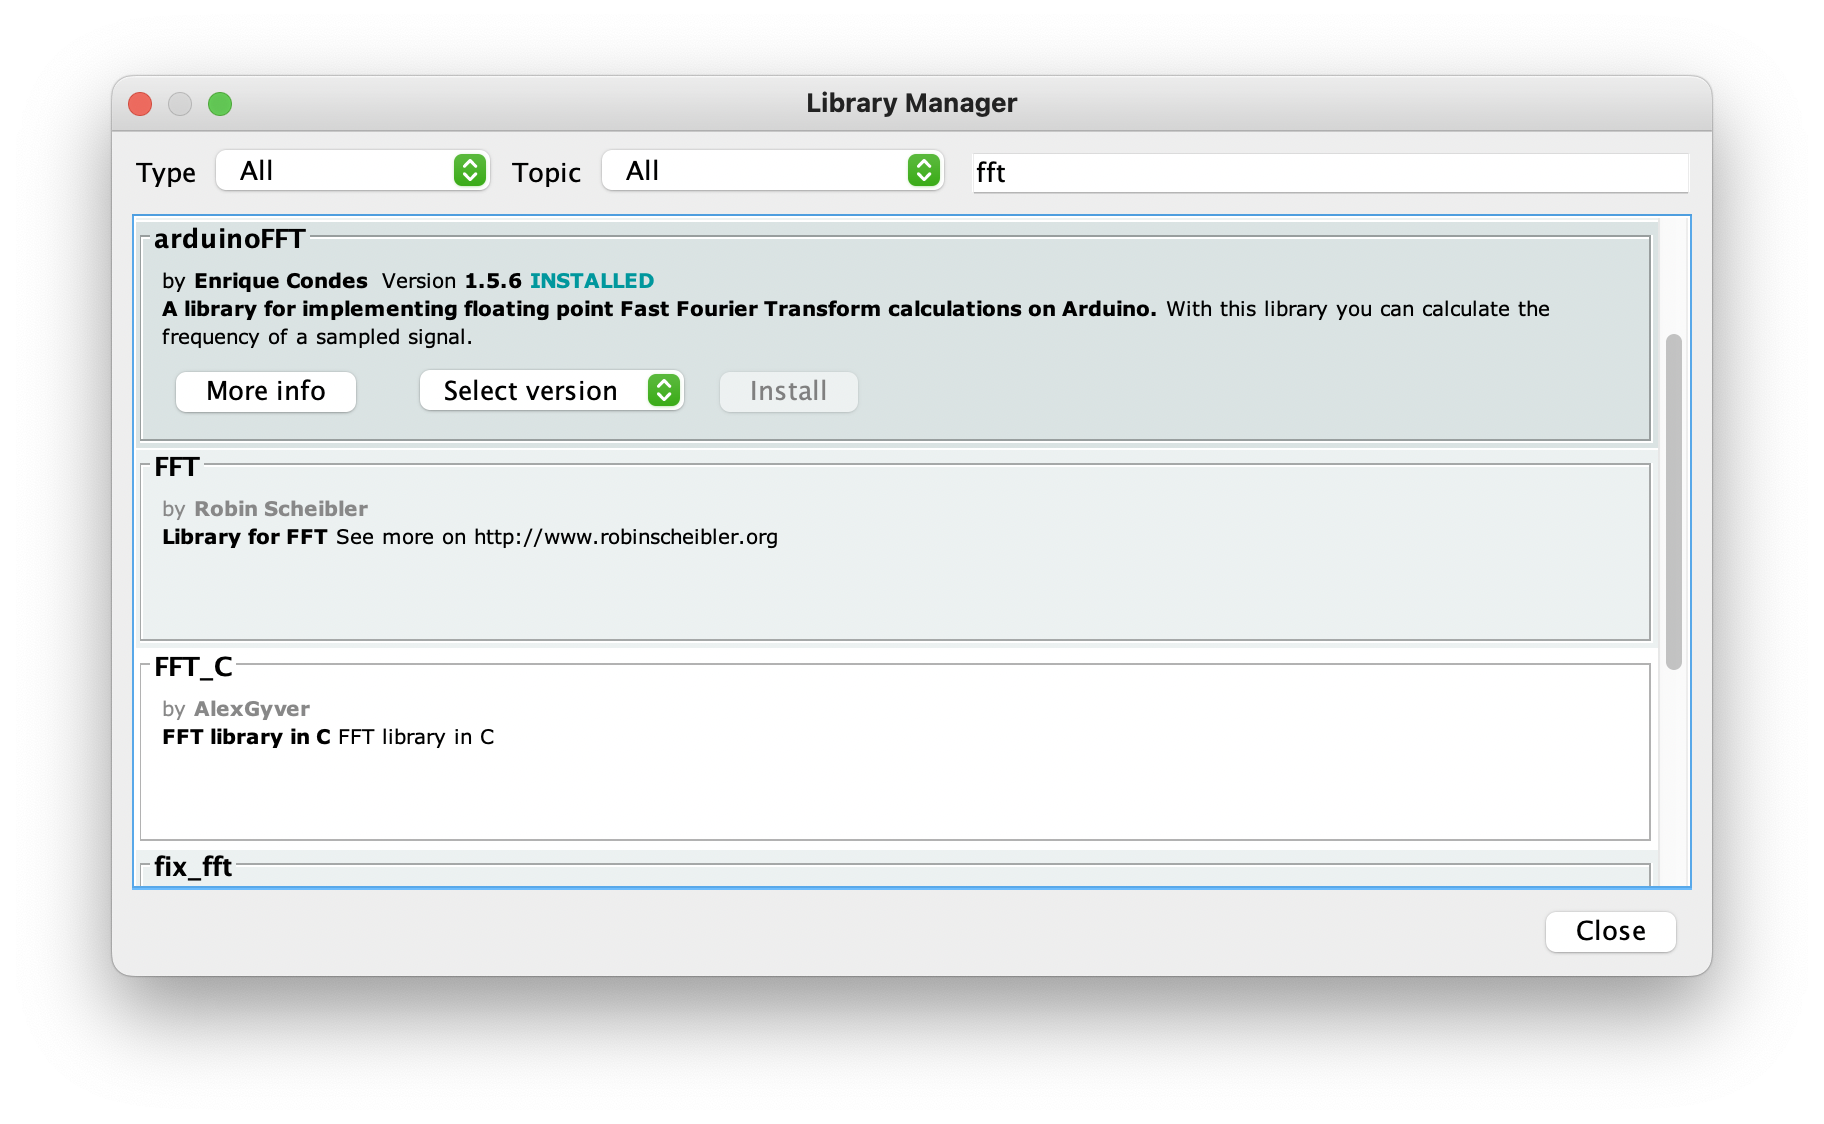
그러면 예제에 arduinoFFT에서 FFT_01을 찾아 클릭한다.

아래와 같은 코드가 생성된다. 이제 이를 실행시켜 보자.
/*

	Example of use of the FFT libray
        Copyright (C) 2014 Enrique Condes

	This program is free software: you can redistribute it and/or modify
	it under the terms of the GNU General Public License as published by
	the Free Software Foundation, either version 3 of the License, or
	(at your option) any later version.

	This program is distributed in the hope that it will be useful,
	but WITHOUT ANY WARRANTY; without even the implied warranty of
	MERCHANTABILITY or FITNESS FOR A PARTICULAR PURPOSE.  See the
	GNU General Public License for more details.

	You should have received a copy of the GNU General Public License
	along with this program.  If not, see <http://www.gnu.org/licenses/>.

*/

/*
  In this example, the Arduino simulates the sampling of a sinusoidal 1000 Hz
  signal with an amplitude of 100, sampled at 5000 Hz. Samples are stored
  inside the vReal array. The samples are windowed according to Hamming
  function. The FFT is computed using the windowed samples. Then the magnitudes
  of each of the frequencies that compose the signal are calculated. Finally,
  the frequency with the highest peak is obtained, being that the main frequency
  present in the signal.
*/

#include "arduinoFFT.h"

arduinoFFT FFT = arduinoFFT(); /* Create FFT object */
/*
These values can be changed in order to evaluate the functions
*/
const uint16_t samples = 64; //This value MUST ALWAYS be a power of 2
const double signalFrequency = 1000;
const double samplingFrequency = 5000;
const uint8_t amplitude = 100;
/*
These are the input and output vectors
Input vectors receive computed results from FFT
*/
double vReal[samples];
double vImag[samples];

#define SCL_INDEX 0x00
#define SCL_TIME 0x01
#define SCL_FREQUENCY 0x02
#define SCL_PLOT 0x03

void setup()
{
  Serial.begin(115200);
  while(!Serial);
  Serial.println("Ready");
}

void loop()
{
  /* Build raw data */
  double cycles = (((samples-1) * signalFrequency) / samplingFrequency); //Number of signal cycles that the sampling will read
  for (uint16_t i = 0; i < samples; i++)
  {
    vReal[i] = int8_t((amplitude * (sin((i * (twoPi * cycles)) / samples))) / 2.0);/* Build data with positive and negative values*/
    //vReal[i] = uint8_t((amplitude * (sin((i * (twoPi * cycles)) / samples) + 1.0)) / 2.0);/* Build data displaced on the Y axis to include only positive values*/
    vImag[i] = 0.0; //Imaginary part must be zeroed in case of looping to avoid wrong calculations and overflows
  }
  /* Print the results of the simulated sampling according to time */
  Serial.println("Data:");
  PrintVector(vReal, samples, SCL_TIME);
  FFT.Windowing(vReal, samples, FFT_WIN_TYP_HAMMING, FFT_FORWARD);	/* Weigh data */
  Serial.println("Weighed data:");
  PrintVector(vReal, samples, SCL_TIME);
  FFT.Compute(vReal, vImag, samples, FFT_FORWARD); /* Compute FFT */
  Serial.println("Computed Real values:");
  PrintVector(vReal, samples, SCL_INDEX);
  Serial.println("Computed Imaginary values:");
  PrintVector(vImag, samples, SCL_INDEX);
  FFT.ComplexToMagnitude(vReal, vImag, samples); /* Compute magnitudes */
  Serial.println("Computed magnitudes:");
  PrintVector(vReal, (samples >> 1), SCL_FREQUENCY);
  double x = FFT.MajorPeak(vReal, samples, samplingFrequency);
  Serial.println(x, 6);
  while(1); /* Run Once */
  // delay(2000); /* Repeat after delay */
}

void PrintVector(double *vData, uint16_t bufferSize, uint8_t scaleType)
{
  for (uint16_t i = 0; i < bufferSize; i++)
  {
    double abscissa;
    /* Print abscissa value */
    switch (scaleType)
    {
      case SCL_INDEX:
        abscissa = (i * 1.0);
	break;
      case SCL_TIME:
        abscissa = ((i * 1.0) / samplingFrequency);
	break;
      case SCL_FREQUENCY:
        abscissa = ((i * 1.0 * samplingFrequency) / samples);
	break;
    }
    Serial.print(abscissa, 6);
    if(scaleType==SCL_FREQUENCY)
      Serial.print("Hz");
    Serial.print(" ");
    Serial.println(vData[i], 4);
  }
  Serial.println();
}
전과 같이 컴파일하고 업로드한 후 시리얼 모니터를 켜보자. 1004.22567은 1004hz 에서 가장 큰 값을 가졌다고 말해 주는 것이다.
(아래 사진에서 왼쪽은 주파수 오른쪽은 값이다.)

'esp32' 카테고리의 다른 글
| 아두이노 개발 환경에서 esp32 블루투스 예제 다뤄보기 (0) | 2022.10.02 |
|---|---|
| 4. i2c_simple_main.c 분석 (0) | 2022.08.02 |
| 3. uart_async_rxtxtasks_main.c 분석 (0) | 2022.07.28 |
| 2. blink_example_main.c 분석 (0) | 2022.07.24 |
| 1. hello_world_main.c 분석 (0) | 2022.07.04 |